
Overview
NVDA earnings are back in focus after Nvidia Corp posted another quarter of results that topped Wall Street’s EPS estimate. Nvidia sits in the semiconductor industry, the chips that power everything from data centers to gaming rigs, and it has become one of the most-watched names in that space thanks to the buildout of AI computing infrastructure. Shares currently trade around $218.29, essentially flat on the day at -0.0321%, which suggests the market isn’t reacting with major surprise to whatever news is circulating right now.
On the valuation side, Nvidia’s trailing twelve-month P/E ratio sits at 27.2751, with trailing EPS of $7.9108. For readers newer to these terms: P/E, or price-to-earnings ratio, tells you how much investors are paying for each dollar of the company’s past-year earnings. A P/E in the high-20s isn’t unusually stretched for a company growing as fast as Nvidia has been. Revenue growth year-over-year came in at 83.38%, a figure that gives useful context for why the market has kept bidding shares higher over the past couple of years despite an already-large market capitalization.
Latest Quarter (Beat or Miss?)
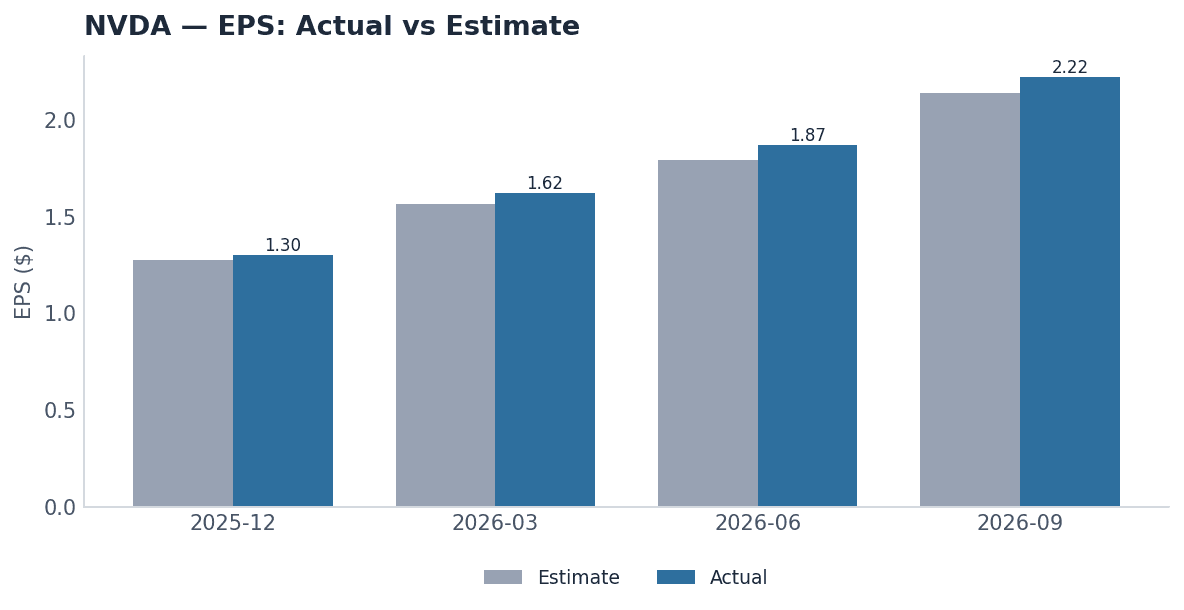
The most recent quarter on record, for the period ended 2026-09-30, was a beat. Nvidia reported actual EPS of $2.22 against an analyst estimate of $2.1384, a surprise of 3.8159%. In plain terms, a “beat” simply means the company earned more per share than analysts had collectively predicted going into the report. A “miss” would be the opposite — earning less than expected. Beating estimates doesn’t guarantee a stock will rise on the news, but it does tell you that the company’s actual business performance outran the consensus view heading into the print.
This wasn’t a narrow squeaker of a beat, but it also wasn’t the largest surprise Nvidia has produced in the four quarters shown here. A surprise of roughly 3.8% sits comfortably above zero, meaning actual results cleared the bar with room to spare, though it was slightly smaller than the beat recorded in the prior quarter. For a company of Nvidia’s size, where estimates are built by dozens of analysts closely tracking chip demand, clearing consensus by nearly 4 percentage points on EPS is a meaningful data point rather than a rounding error.
Earnings Trend Across the Quarters
Looking at the four most recent quarters together tells a more complete story than any single print. Starting from 2025-12-31 and moving forward: EPS of $1.30 beat an estimate of $1.2746 (a 1.9928% surprise); then $1.62 beat $1.5634 (3.6203% surprise); then $1.87 beat $1.7922 (4.341% surprise); and most recently $2.22 beat $2.1384 (3.8159% surprise). Every single one of these four quarters was a beat — not one miss in the group. That’s a notable pattern of consistency, especially for a company whose numbers are watched as closely as Nvidia’s.
The surprise percentages themselves also tell a story. They climbed from just under 2% to over 4% between the first two quarters shown, then dipped slightly to 3.8159% in the latest quarter. That kind of pattern — beats growing larger, then moderating a touch — can suggest that analysts have been recalibrating their models upward as they get more comfortable with Nvidia’s growth trajectory, narrowing the gap between what they expect and what the company delivers. It doesn’t necessarily mean momentum is slowing in the underlying business; it may simply mean forecasters are catching up to the pace of growth. Either reading is possible from the numbers alone, and neither can be confirmed without more data on what’s driving each quarter’s results.
What It Means
Four consecutive EPS beats, paired with 83.38% year-over-year revenue growth, paints a picture of a company that has been executing at a high level relative to what analysts modeled. For investors trying to understand NVDA earnings in context, this consistency matters because it reduces (though never eliminates) the uncertainty around near-term expectations. When a company beats estimates quarter after quarter, some of that expected outperformance may already get priced into the stock ahead of the next report, which is one reason shares don’t always jump sharply even after a solid beat — as today’s essentially flat price action illustrates.
It’s also worth remembering what these figures don’t tell us. The estimate-versus-actual EPS numbers say nothing directly about forward guidance, next quarter’s demand environment, or the competitive landscape in AI chips — including how rivals such as Micron are positioned, a topic referenced in recent headlines but not something these earnings figures confirm one way or another. Headlines about other stocks hitting 52-week highs, viral commentary on AI sentiment, or analysis of competitors are part of the broader news cycle around the sector, but they are separate from the hard EPS data covered here and shouldn’t be read as validated facts simply because they’re circulating. The safest conclusion from the numbers alone is that Nvidia’s actual profitability has consistently outpaced what analysts expected over this four-quarter stretch, and that revenue growth remains very high by almost any large-cap standard.
Bottom Line
NVDA earnings have shown a clean run of beats over the last four reported quarters, with the most recent quarter delivering $2.22 in EPS against a $2.1384 estimate, a beat of roughly 3.82%. The trend of surprise percentages rose before moderating slightly in the latest print, while revenue growth of 83.38% year-over-year underscores the scale of demand Nvidia has been capturing. None of this constitutes a signal to buy or sell shares trading near $218.29; it’s simply a read of how actual results have compared with expectations.
Investors watching this name going forward may want to track whether the beat streak continues, whether surprise percentages keep narrowing or reaccelerate, and how the P/E of 27.2751 evolves as trailing EPS moves higher. Those three threads — consistency of beats, size of surprises, and valuation relative to earnings — are the concrete, data-backed questions that this set of numbers puts on the table for the next report.
Disclaimer: This article is for informational purposes only and is not investment advice. Data is sourced from Finnhub and may be delayed. Do your own research before making any investment decisions.
Explore more US stock analysis on Dona Dona.