
Intro: Why NVDA AMD AVGO Comparison Matters Now
This NVDA AMD AVGO comparison uses an archived Finnhub snapshot to examine valuation, profitability, revenue growth and analyst recommendations. The figures describe the supplied records, not live market conditions. Comparing the same metrics across the companies can make the trade-offs easier to see without treating a lower multiple as proof of undervaluation.
Valuation: The P/E Perspectives on NVDA AMD AVGO
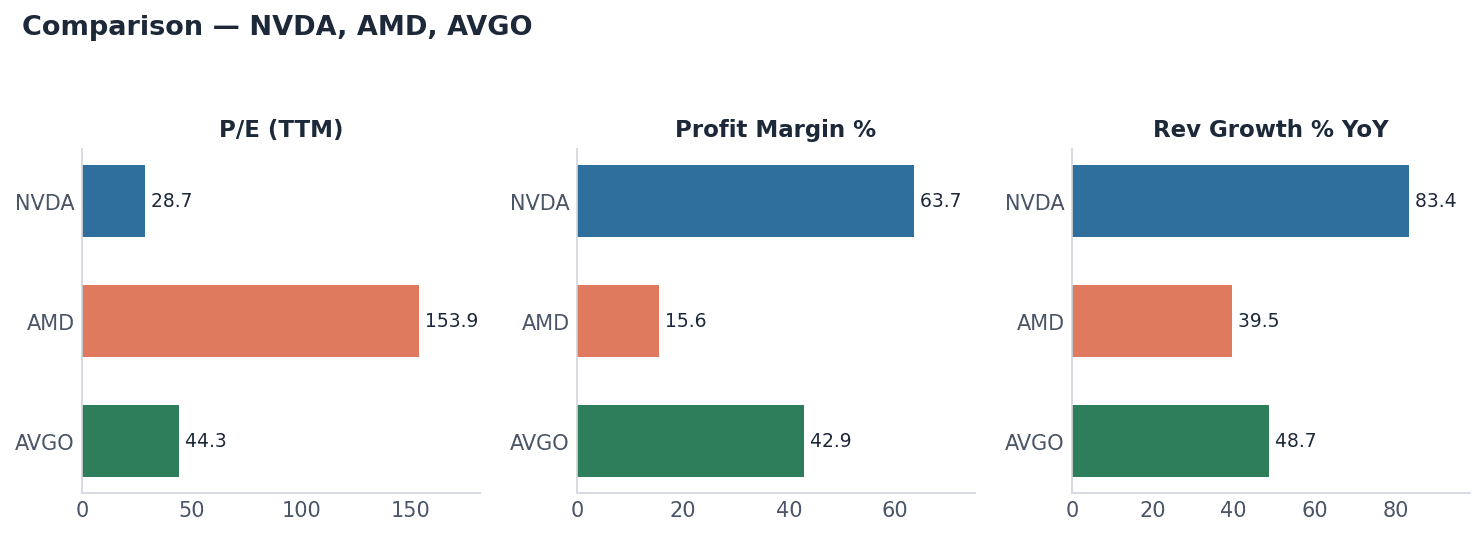
The price-to-earnings (P/E) ratio compares the market price with earnings. In the supplied snapshot, NVDA has a P/E of 28.7145, AVGO has a P/E of 44.3131 and AMD has a P/E of 153.8507. NVDA therefore has the lowest multiple among these stocks. That comparison alone does not establish which stock is undervalued or which will deliver the strongest return.
For a global investor trying to read these numbers, the takeaway is that AMD’s market price is comparatively high relative to its current profits, with its P/E sitting far above the other two. AVGO’s P/E is significantly higher than NVDA’s, but well below AMD’s. These differences mean that the market is pricing AMD for higher potential future earnings, or at least giving it a premium multiple. NVDA looks “cheaper” by this basic measure, but as always, there’s more to the story than the multiple alone.
The real trade-off emerges here: some investors are often drawn to stocks with lower P/E multiples, but they may be giving up exposure to faster topline growth or other unique business strengths. Others might be willing to pay premium valuations in the hope of outsized growth or market leadership. The NVDA AMD AVGO set offers examples of each approach in action within the same sector.
Growth & Profitability: Margin, ROE, and Revenue Comparisons
Turning to margin, return on equity (ROE), and revenue growth, these metrics give a sense of how efficiently each company turns sales into profits, and how fast those sales are expanding. NVDA posts a margin of 63.66%, which is the highest among this set. AVGO follows with a margin of 42.94%. AMD’s margin is the most modest of the group at 15.58%. These numbers reflect different business models and operational scales; higher margins can hint at a company’s pricing power or cost management, while lower ones may result from heavy investments or a more competitive segment.
Return on equity (ROE) relates profit to shareholders’ equity. NVDA has an ROE of 110.11%, AVGO has an ROE of 43.91% and AMD has an ROE of 10.07% in the supplied snapshot. These values rank NVDA highest. The snapshot does not include the equity movements or accounting detail needed to explain the differences, so ROE alone is not enough to judge business quality.
NVDA has year-on-year revenue growth of 83.38%, AVGO has revenue growth of 48.69% and AMD has revenue growth of 39.54% in the supplied data. NVDA has the highest growth rate in this comparison. These figures show growth relative to the earlier comparison period; without a sequence of prior growth rates, they do not establish whether growth is accelerating.
Analyst Views: What the Market Expects from NVDA AMD AVGO
Analyst consensus can serve as a snapshot of market expectations, though it should never be a sole factor in any investment decision. Reviewing forecasts for NVDA, there are 24 strong buy, 41 buy, 3 hold, 1 sell, and 0 strong sell recommendations as of 2026-09-01. AMD draws 17 strong buy, 32 buy, 10 hold, and no sell or strong sell recommendations. AVGO’s tally stands at 17 strong buy, 35 buy, 5 hold, and likewise no sell or strong sell calls.
What stands out here is that each stock carries a significant number of “buy” and “strong buy” recommendations. NVDA does have a single “sell,” but the majority view remains positive across all three companies. Hold recommendations are highest for AMD. The supplied recommendation snapshot records no “strong sell” ratings for these companies.
The analyst mix hints at robust confidence in these leaders but also shows pockets of caution—especially in the greater number of “hold” ratings for AMD and AVGO relative to NVDA. This could reflect questions about valuation, execution risk, or simply different paces of expected growth. When metrics are compared side by side, readers should consider how this analyst sentiment matches up with the accompanying valuation and growth numbers.
Bottom Line: Trade-Offs in the NVDA AMD AVGO Discussion
The supplied metrics do not establish a single winner. NVDA has the highest margin, ROE and revenue growth and the lowest P/E among these companies. AMD has the highest P/E and the lowest margin in the comparison. AVGO sits between them on these metrics. These are comparisons within the supplied group; there is no market valuation benchmark in the data.
Each stock’s combination of price, growth, profitability, and analyst support offers a unique balance of risk and reward. Globally minded investors might weigh these factors differently depending on their priorities. Watching how these numbers shift over time could offer new clues on sentiment swings or underlying change in the sector.
Disclaimer: This article is for informational purposes only and is not investment advice. Data is sourced from Finnhub and may be delayed. Do your own research before making any investment decisions.
Explore more US stock analysis on Dona Dona.