
Intro
This payments stocks comparison looks at three names that sit at very different points in the digital payments story: Visa (V) at $375.62, Mastercard (MA) at $573.27, and PayPal (PYPL) at $53.81. All three are classified under Financial Services and all three make money by moving money, but the way the market prices them right now tells very different stories about growth expectations, profitability, and risk.
Visa and Mastercard run the card networks that banks and merchants rely on for authorization and settlement, a business model that produces very high margins because the infrastructure is already built and scales with transaction volume. PayPal operates more like a consumer-facing wallet and checkout layer, competing on a thinner margin structure while still processing enormous transaction volumes of its own. That structural difference shows up clearly once you line up the numbers side by side.
The point of this comparison isn’t to declare a winner. It’s to walk through what the valuation multiples, profitability metrics, growth rates, and analyst sentiment actually show, so readers can judge for themselves which trade-offs matter most to them.
Valuation: Comparing P/E Across the Group
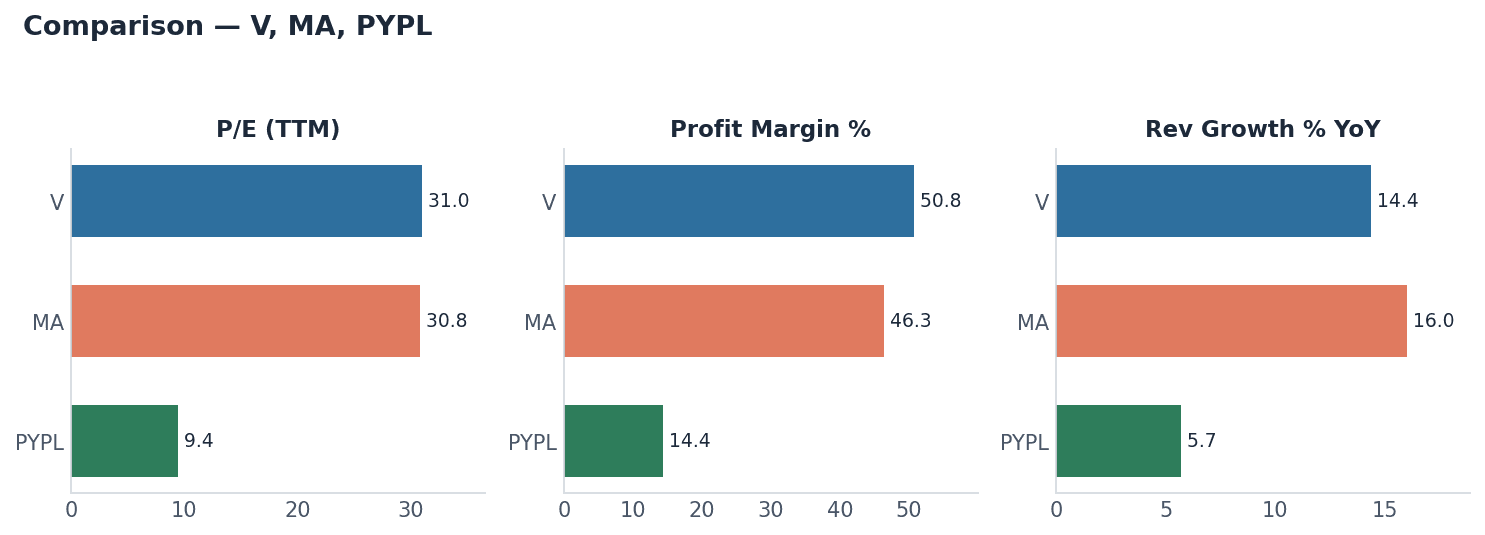
Start with the price-to-earnings ratio, which tells you how much investors are paying today for each dollar of current earnings. Visa trades at a P/E of roughly 30.9998 and Mastercard at roughly 30.811 — essentially the same multiple, within a rounding error of each other. That’s notable on its own: the market is pricing these two card networks almost identically on an earnings basis, despite some differences in their underlying growth and profitability numbers, which we’ll get to shortly.
PayPal is the outlier here, trading at a P/E of just 9.3905 — less than a third of where Visa and Mastercard sit. On the surface, that looks like a much cheaper stock. A lower P/E can mean the market expects slower growth, sees more risk in the business, or simply hasn’t re-rated the stock alongside the card networks. It can also mean the stock is statistically “cheap” relative to its own earnings power, depending on how the rest of the fundamentals hold up.
The gap between roughly 31x for the two networks and roughly 9x for PayPal is the single most striking figure in this payments stocks comparison. Cheaper isn’t automatically better, and expensive isn’t automatically worse — the multiple only means something once you weigh it against growth, margins, and return on capital, which is exactly where the divergence between these three names gets more interesting.
Growth & Profitability
Margins separate this group sharply. Visa posts a margin of 50.78%, Mastercard comes in at 46.34%, and PayPal trails well behind at 14.36%. Visa and Mastercard keep roughly half of every revenue dollar as profit, which is a reflection of their network-toll business model — they don’t hold consumer credit risk or run costly point-of-sale infrastructure the way a payments processor with a broader product stack does. PayPal’s margin, while much lower than the networks, still reflects a business that runs at meaningfully positive profitability, just with a cost structure that eats a larger share of revenue.
Return on equity paints an even more dramatic picture. Mastercard’s ROE is 232.48%, a very high figure that generally reflects a capital-light business model combined with the effects of share buybacks reducing the equity base over time. Visa’s ROE of 61.26% is also strong by almost any standard, just far below Mastercard’s number. PayPal’s ROE of 24.42% is the lowest of the three, but it’s still a healthy double-digit return that many industries outside payments would consider solid.
On revenue growth, Mastercard leads at 16.01% year-over-year, Visa follows at 14.39%, and PayPal trails at 5.69%. This is where the valuation gap starts to make more sense: Mastercard and Visa are growing revenue faster and doing so at much higher margins and returns on equity, which helps justify multiples that sit near 31x earnings. PayPal’s slower 5.69% growth, paired with thinner margins, offers a partial explanation for why its P/E sits so much lower than the network operators. The trade-off is straightforward — investors weighing this payments stocks comparison are essentially choosing between paying a premium multiple for faster growth and higher profitability (Visa, Mastercard) or a discounted multiple attached to slower growth and thinner margins (PayPal).
Analyst Views
Wall Street sentiment, as of September 1, 2026, mirrors the fundamental picture fairly closely. Visa’s coverage stands at 12 strong buy, 33 buy, 6 hold, 0 sell, and 0 strong sell ratings — a heavily bullish tilt with zero negative ratings in the mix. Mastercard’s consensus is similarly weighted toward the bullish side: 13 strong buy, 36 buy, 5 hold, 0 sell, and 0 strong sell. Both networks show almost no analyst skepticism at all, with holds representing a small minority of total coverage and no sell-rated opinions on either name.
PayPal’s analyst picture looks fundamentally different. Its consensus breaks down as 4 strong buy, 10 buy, 35 hold, 3 sell, and 0 strong sell. The dominant rating by far is “hold,” with 35 analysts sitting on the fence compared to just 14 combined buy and strong buy ratings, and 3 analysts actively rated sell. That’s a much more divided, cautious stance than what we see on Visa or Mastercard.
This split in analyst sentiment lines up with the growth and margin data already covered. Coverage on Visa and Mastercard is concentrated almost entirely in buy and strong buy territory, consistent with businesses posting double-digit revenue growth, margins near or above 46%, and standout ROE figures. PayPal’s heavier concentration of hold ratings, plus a handful of sells, reflects the slower 5.69% growth rate and the more modest 14.36% margin discussed above. None of this amounts to a definitive signal in either direction — consensus ratings shift and represent aggregated opinions, not certainty — but the pattern is consistent with everything else in this comparison.
Bottom Line
Lay the numbers next to each other and a clear pattern emerges. Visa and Mastercard trade at nearly identical P/E ratios near 31x, backed by strong margins (50.78% and 46.34%), high ROE (61.26% and 232.48%), and double-digit revenue growth (14.39% and 16.01%). Analyst coverage on both is overwhelmingly bullish, with no sell ratings recorded on either name as of September 1, 2026.
PayPal presents a different set of trade-offs entirely: a much lower P/E of 9.3905, a thinner 14.36% margin, a lower but still respectable 24.42% ROE, slower 5.69% revenue growth, and an analyst base that’s split, with holds dominating the consensus and a few sell ratings mixed in. Whether that lower multiple represents an opportunity or a fair reflection of slower growth and lower profitability is exactly the kind of judgment call each investor has to make on their own.
This payments stocks comparison isn’t meant to declare Visa, Mastercard, or PayPal the “better” stock — it’s meant to lay out what the valuation, profitability, growth, and analyst data actually say, so the trade-offs are visible rather than hidden inside a single price quote. Each of these three companies occupies a different spot on the growth-versus-value spectrum within the same broad payments sector, and that spectrum is worth understanding before drawing any conclusions of your own.
Disclaimer: This article is for informational purposes only and is not investment advice. Data is sourced from Finnhub and may be delayed. Do your own research before making any investment decisions.
Explore more US stock analysis on Dona Dona.